Stock Market

Decoding Candlestick Patterns: A Comprehensive Guide for Traders

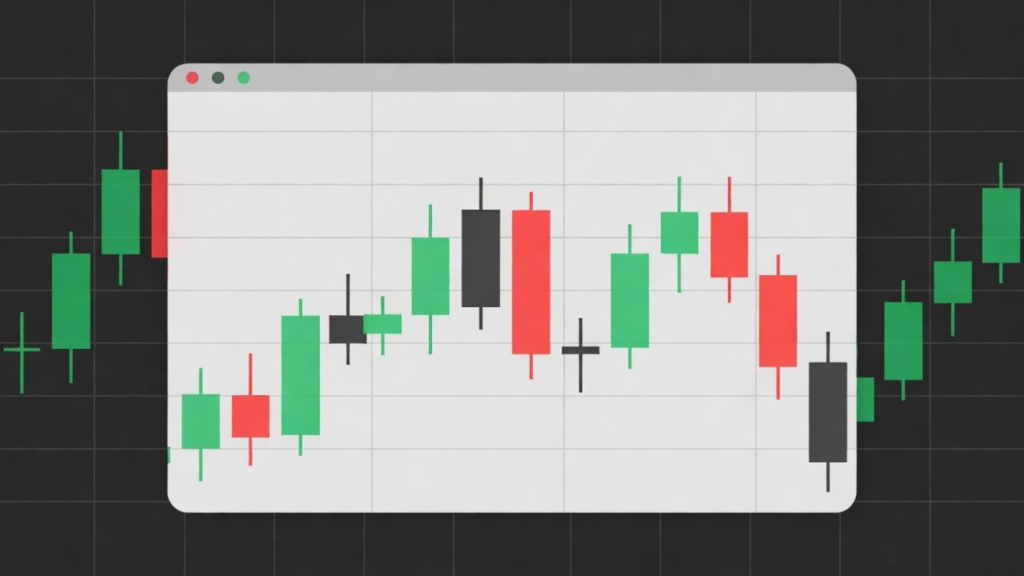
Candlestick patterns are a visual representation of price movements over a specific period. Originating in 18th-century Japan, where they were used to track the price of rice, these patterns offered valuable insights into market sentiment and potential future price direction. Unlike simple line charts that only display closing prices, candlestick charts provide a more detailed picture by showing the open, high, low, and close prices for each period.

Stock Market

Why 95% of traders don’t SUCCEED?

Most traders don’t fail because the market is unfair, they fail because they approach it without discipline or a clear plan. Many jump in chasing quick profits, ignore risk management, and let emotions like fear and greed control their decisions. Overtrading, lack of proper knowledge, and unrealistic expectations turn small losses into big ones. Successful trading requires patience, consistency, and a tested strategy. Those who treat trading like a skill to master, rather than a shortcut to easy money are the ones who eventually stand out from the majority.

Stock Market

How to Create a Winning Trading Plan

The most effective way to prevent emotions from affecting your trading decisions is to build a solid plan and stick to it. With a well-defined strategy in place, sudden price surges, losses, rumors, or market FUD won’t knock you off course.

Scroll to Top